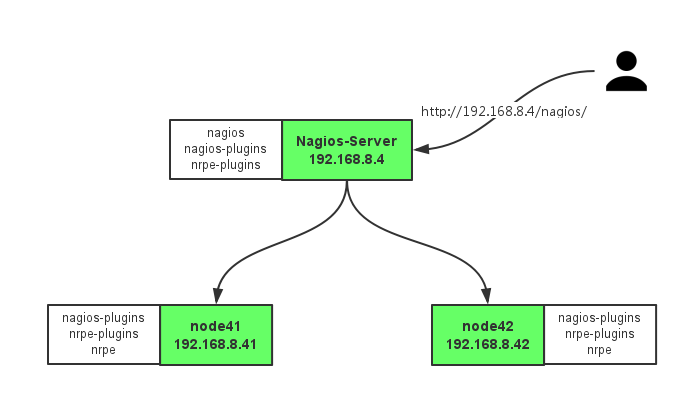
实验环境拓扑:
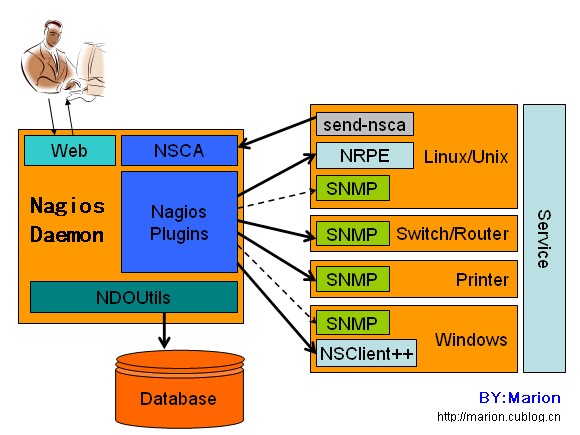
Nagios通常由一个主程序(Nagios)、一个插件程序(Nagios-plugins)和四个可选的ADDON(NRPE、NSCA、NSClient++和NDOUtils)组成。Nagios的监控工作都是通过插件实现的,因此,Nagios和Nagios-plugins是服务器端工作所必须的组件。而四个ADDON中,NRPE用来在监控的远程Linux/Unix主机上执行脚本插件以实现对这些主机资源的监控;NSCA用来让被监控的远程Linux/Unix主机主动将监控信息发送给Nagios服务器(这在冗余监控模式中特别要用到);NSClient++是用来监控Windows主机时安装在Windows主机上的组件;而NDOUtils则用来将Nagios的配置信息和各event产生的数据存入数据库,以实现这些数据的快速检索和处理。这四个ADDON(附件)中,NRPE和NSClient++工作于客户端,NDOUtils工作于服务器端,而NSCA则需要同时安装在服务器端和客户端。
Linux主机监控之NRPE插件安装配置 Linux主机监控包括:外部服务和本地信息两部分。外部服务如http,ftp,ssh等对外开放服务直接获取,但Linux主机本地状态信息(内存、CPU、磁盘、进程)的获取无法直接获取,Nagios通过nrpe插件来完成Linux主机本地信息的获取。
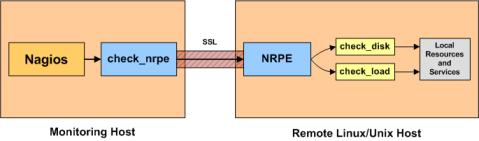
check_nrpe 插件,位于监控主机上
当Nagios 需要监控某个远程Linux 主机的服务或者资源情况时:
监控主机: Nagios 会运行check_nrpe 这个插件,告诉它要检查什么;
一、被监控机 通过epel源在被监控主机安装nrpe及相关插件:
1
2
3
4
5
6
7
8
9
10
11
12
13
14
15
16
17
18
19
20
21
22
23
24
25
26
27
28
29
30
31
32
33
34
35
36
yum install -y epel-release yum install -y nagios-plugins nagios-plugins-all nrpe nagios-plugins-nrpe [five@node41 plugins]$ cd /usr/lib64/nagios/plugins [five@node41 plugins]$ ls check_breeze check_dummy check_ide_smart check_mrtg check_ntp check_pop check_ssh negate check_by_ssh check_file_age check_imap check_mrtgtraf check_ntp_peer check_procs check_ssmtp urlize check_clamd check_flexlm check_ircd check_mysql check_ntp.pl check_real check_swap utils.pm check_cluster check_fping check_jabber check_mysql_query check_ntp_time check_rpc check_tcp utils.sh check_dhcp check_ftp check_ldap check_nagios check_nwstat check_sensors check_time check_dig check_game check_ldaps check_nntp check_oracle check_simap check_udp check_disk check_hpjd check_load check_nntps check_overcr check_smtp check_ups check_disk_smb check_http check_log check_nrpe check_pgsql check_snmp check_users check_dns check_icmp check_mailq check_nt check_ping check_spop check_wave vim /etc/nagios/nrpe.cfg 找到“allowed_hosts=127.0.0.1” 改为 “allowed_hosts=127.0.0.1,192.168.8.4” 后面的ip为服务端ip; 找到“dont_blame_nrpe=0” 改为“dont_blame_nrpe=1” 修改 command[check_hda1]=/usr/lib64/nagios/plugins/check_disk -w 20% -c 10% -p /dev/hda1 为: command[check_hda1]=/usr/lib64/nagios/plugins/check_disk -w 20% -c 10% -p /dev/sda1 被监控主机重启nrpe服务:sudo systemctl restart nrpe 确认nrpe已运行: [five@node41 nagios]$ systemctl status nrpe ● nrpe.service - NRPE Loaded: loaded (/usr/lib/systemd/system/nrpe.service; enabled; vendor preset: disabled) Active: active (running) since Sun 2016-04-10 11:01:59 EDT; 8min ago Process: 5807 ExecStart=/usr/sbin/nrpe -c /etc/nagios/nrpe.cfg -d $NRPE_SSL_OPT (code=exited, status=0/SUCCESS) Main PID: 5808 (nrpe) CGroup: /system.slice/nrpe.service └─5808 /usr/sbin/nrpe -c /etc/nagios/nrpe.cfg -d [five@node41 nagios]$ netstat -an | grep 5666 tcp 0 0 0.0.0.0:5666 0.0.0.0:* LISTEN tcp6 0 0 :::5666 :::* LISTEN
二、监控主机 之前已按照Nagios Setup | 服务器监测之Nagios编译安装 在监控主机上安装了Nagios及相关插件。
1
2
3
4
5
6
yum install -y epel-release yum install -y httpd nagios nagios-plugins nagios-plugins-all nrpe nagios-plugins-nrpe 设置登录nagios后台的用户和密码:htpasswd -c /etc/nagios/passwd nagiosadmin nagios -v /etc/nagios/nagios.cfg 检测配置文件 启动服务:service httpd start; service nagios start 浏览器访问: http://ip/nagios
完成Nagios及各个plugins安装后,确保已成功运行Nagios并可通过web访问。
objects/commands.cfg下增加check_nrpe命令
1
2
3
4
5
# 'check_nrpe' command definition define command{ command_name check_nrpe command_line $USER1$/check_nrpe -H $HOSTADDRESS$ -c $ARG1$ }
1
2
3
4
5
6
7
8
9
10
11
12
13
14
15
16
17
18
19
20
21
22
23
24
25
26
27
28
29
30
31
32
33
34
35
36
37
38
39
40
41
42
43
44
45
46
47
48
49
50
51
52
53
54
55
56
57
58
59
60
61
62
63
64
65
66
67
68
69
70
71
72
73
74
75
76
77
78
79
80
81
82
83
84
85
86
87
88
89
90
91
92
93
94
95
96
97
98
cd /usr/local/nagios/etc/objects sudo touch node41.cfg sudo vi node41.cfg define host{ use linux-server host_name node41 alias node41 address 192.168.8.41 } define service{ use generic-service host_name node41 service_description check_ping check_command check_ping!100.0,20%!200.0,50% max_check_attempts 5 normal_check_interval 1 } define service{ use generic-service host_name node41 service_description check_ssh check_command check_ssh max_check_attempts 5 ;当nagios检测到问题时,一共尝试检测5次都有问题才会告警,如果该数值为1,那么检测到问题立即告警 normal_check_interval 1 ;重新检测的时间间隔,单位是分钟,默认是3分钟 notification_interval 60 ;在服务出现异常后,故障一直没有解决,nagios再次对使用者发出通知的时间。单位是分钟。如果你认为,所有的事件只需要一次通知就够了,可以把这里的选项设为0。 } # define service{ # use generic-service # host_name node41 # service_description check_http # check_command check_http # max_check_attempts 5 # normal_check_interval 1 # } define service{ use generic-service host_name node41 service_description Current Load check_command check_nrpe!check_load } define service{ use generic-service host_name node41 service_description Root Partition check_command check_nrpe!check_hda1 } 注意:这里的`check_nrpe!check_hda1`是与被监控主机中/etc/nagios/nrpe.cfg中`command[check_hda1]=/usr/lib64/nagios/plugins/check_disk -w 20% -c 10% -p /dev/sda1`相对应的。 * 校验配置文件格式是否合法 [five@nagios-server objects]$ sudo /usr/local/nagios/bin/nagios -v /usr/local/nagios/etc/nagios.cfg Nagios Core 4.1.1 Copyright (c) 2009-present Nagios Core Development Team and Community Contributors Copyright (c) 1999-2009 Ethan Galstad Last Modified: 08-19-2015 License: GPL Website: https://www.nagios.org Reading configuration data... Read main config file okay... Read object config files okay... Running pre-flight check on configuration data... Checking objects... Checked 13 services. Checked 2 hosts. Checked 1 host groups. Checked 0 service groups. Checked 1 contacts. Checked 1 contact groups. Checked 25 commands. Checked 5 time periods. Checked 0 host escalations. Checked 0 service escalations. Checking for circular paths... Checked 2 hosts Checked 0 service dependencies Checked 0 host dependencies Checked 5 timeperiods Checking global event handlers... Checking obsessive compulsive processor commands... Checking misc settings... Total Warnings: 0 Total Errors: 0 Things look okay - No serious problems were detected during the pre-flight check * 重启监控机的nagios服务 sudo systemctl restart nagios
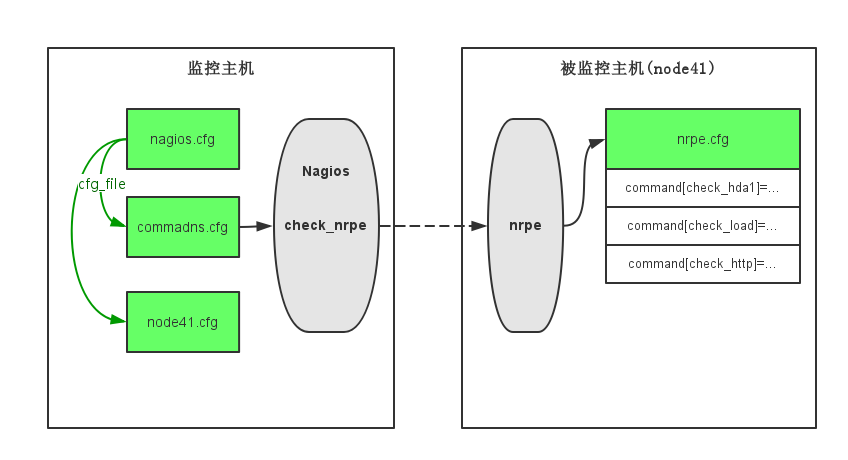
Nagios下nrpe的配置关系图:
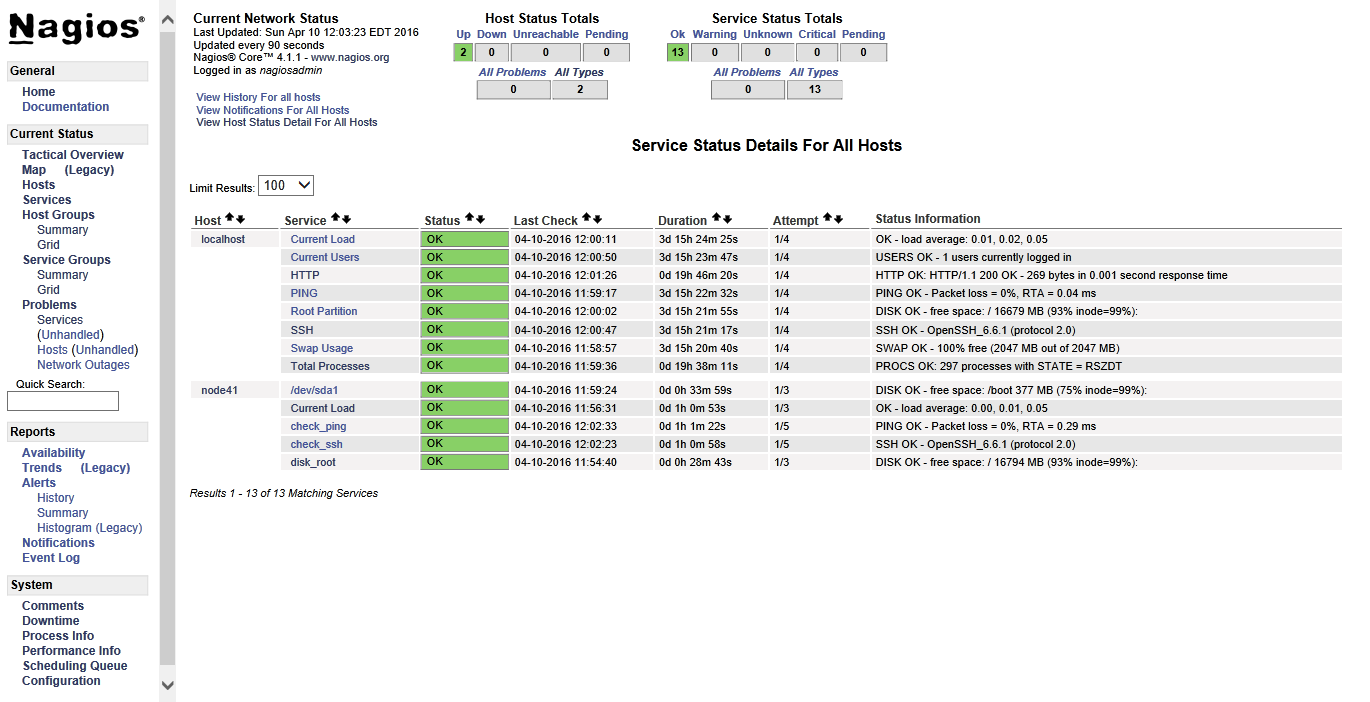
添加node41监控后的效果图:
总结 监控系统获取被监控主机信息的方式无外乎:snmp或在被监控主机安装特定软件实现信息传递。
参考文献
Nagios与pnp4nagios安装配置备忘 Gist: setup Nagios and png4nagios